With more than 30 million monthly users, TradingView is a viral and trusted charting platform for investors and traders. Many consider it the best stock analysis software and one of the best stock screeners available. In this review, we will guide you through all of its features and functionalities.
Additionally, we will explain how to use TradingView for free and how you can save up to 50% by subscribing to a paid plan. So, is TradingView worth it? We think so.

TradingView Features
TradingView is widely considered one of the best investing, trading, and analysis platforms, offering a range of functionalities that are among the most comprehensive in the industry.
While you can access various free features with the Basic plan, upgrading to a paid plan such as Pro, Pro+, or Premium may be worthwhile if you need access to additional features like multiple charts, real-time market data, advanced chart types, and more.
Additionally, TradingView offers extended trading hours, customizable scanning based on your trading strategies, and a thriving community of users. The platform can be accessed through a browser on any device or as a desktop software installation or mobile app. Let’s take a closer look at some of the top features offered by TradingView.
TradingView Charts
TradingView is a comprehensive platform designed for technical analysis, featuring advanced charting tools and extensive research capabilities. Users can select from various chart types, time frames, and technical indicators and access trading volume insights and powerful drawing tools.
With TradingView Basic, users can open a single chart at a time, while TradingView Premium supports up to 8 charts per screen, each with customizable symbols, time frames, and indicators. Pro-subscribers can export chart data and set custom intervals from one minute to monthly, and Premium subscribers can even use second-based intervals.
Additionally, TradingView Desktop offers additional power, speed, and flexibility, including native multi-monitor support and the ability to create multiple tabs with multiple charts on each. This enables traders to customize their layouts and visualize different data and charts on multiple monitors.
Chart Types
- Bars, Candles, and Hollow Chart
- Columns, Line, Area, and Baseline Charts
- High-Low, Heikin Ashi and Renko Charting Tools
- Line Break, Kagi, Point & Figure, Range Charts
Available Time Frames
- 1, 5, 10, 15, 30-second time frame
- 1, 3, 5, 15, 30, 45-minute time frame
- 1, 2, 3, 4-hour time frame
- daily, weekly, monthly time frame
- 1, 10, 100, 1,000 range
TradingView Trading Indicators
With hundreds of options available, TradingView offers a vast array of trading indicators, from classic choices like Moving Averages and VWAP to volume indicators like Volume Profile and candlestick pattern recognition. Additionally, users can even access auto trendlines for Fibonacci extensions and retracements.
And if that’s not enough, TradingView’s scripting language allows users to code their custom indicators. TradingView has more indicators than any other technical analysis tool on the market.
TradingView Drawing Tools
All plans offer over 90 drawing tools, including lines and trends, geometric shapes, patterns, and annotations. These tools are designed to help investors gain a better understanding of the technical aspects of the markets. With so many options available, traders can easily find the tools to analyze market trends and make informed decisions.
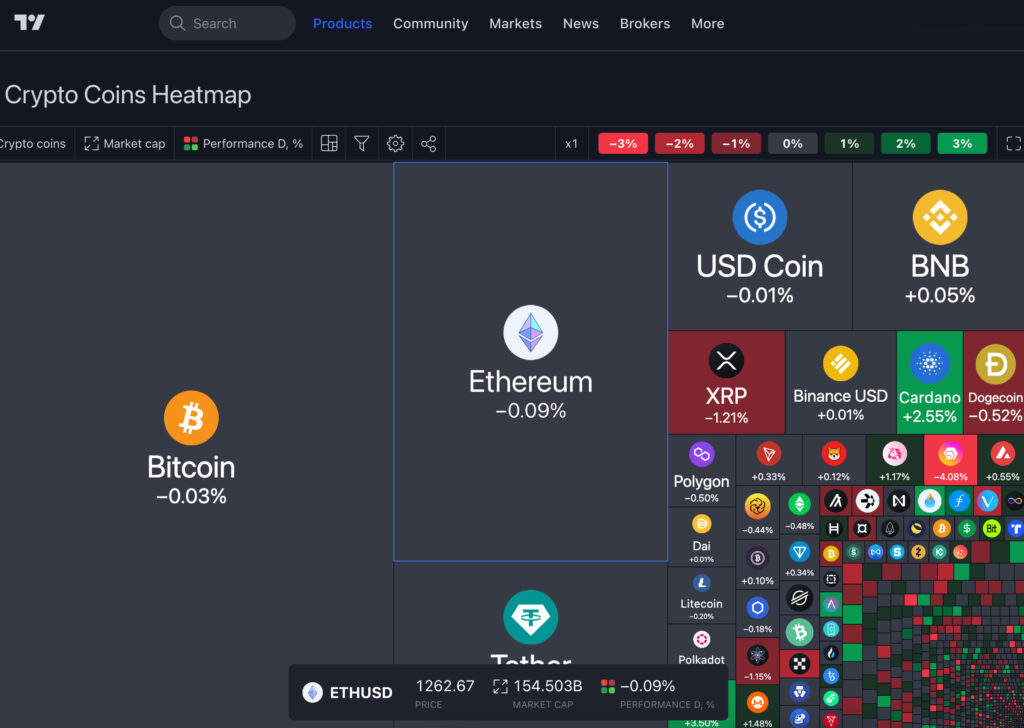
TradingView Heatmaps
The stock heatmap and crypto heatmap are useful tools for visualizing the biggest gainers and decliners in different markets. You can use these heatmaps to filter based on various financial figures, such as market capitalization, daily volume, number of employees, and dividend yield.
Additionally, you can show a heatmap for a specific time interval, like performance over the past 4 hours. The heatmap can also display the biggest up- and down gappers, most volatile stocks, and relative volume ratios. These features allow you to quickly and easily see trends and patterns in the market.
TradingView has a community of over 30 million monthly users, including investors, traders, and financial experts. This community is a valuable resource for beginners and experienced traders alike, as it provides access to live streams, trade ideas, educational content, and custom scripts.
The platform also has an integrated feature called Snaps, where users can post daily stock and crypto snapshots and read the latest market news. The News Flow feature streams the latest news from investing media outlets such as Reuters and Seeking Alpha. TradingView offers server-side alerts, which can be set at specific price levels or on indicators, strategies, or drawings.
Users can choose from several notification methods, including email-to-SMS alerts, visual popups, audio signals, PUSH notifications, email, or webhook notifications. The platform is compatible with several brokerage platforms, allowing users to trade directly from within TradingView.
TradingView also has a paper trading simulator, which lets users practice trading with virtual money and test new ideas and strategies without risk. The simulator has a starting balance of $100,000 and allows users to visualize open positions and new orders on the chart and trading panel. Open orders can be edited, closed, or canceled directly on the chart and panel.
Be the first to try
Join our mailing list for early access to our service